The stock market, as measured by the S&P 500 index
SPX,
has broken out strongly to the upside, trading at new intraday and closing highs. The breakout came on Jan. 19, over the 4,800 level. That now represents support, and that support extends down to 4,680. There is no classical resistance, because the S&P 500 is trading at new all-time highs, but it is now encountering its +4σ “modified Bollinger Band,” which might act as a restraint of sorts.
The sideways movement between 4,680 and 4,800 that took place between mid-December and mid-January is important as a launchpad for this rally. If the S&P 500 should trade back below 4,680, that would be extremely negative.
The McMillan Volatility Band sell signal (the green “S” on the chart above) is still in effect, but it will be stopped out if the S&P 500 closes above the +4σ Band. It touched the Band on Jan. 24 but did not close above it. Today, a close above 4,894 would stop out this sell signal. A new MVB sell signal could eventually set up if that happens, but it would normally take a few days for that to occur. Note that the Band moves daily, so it will not necessarily stay at 4,894 for tomorrow and succeeding days.
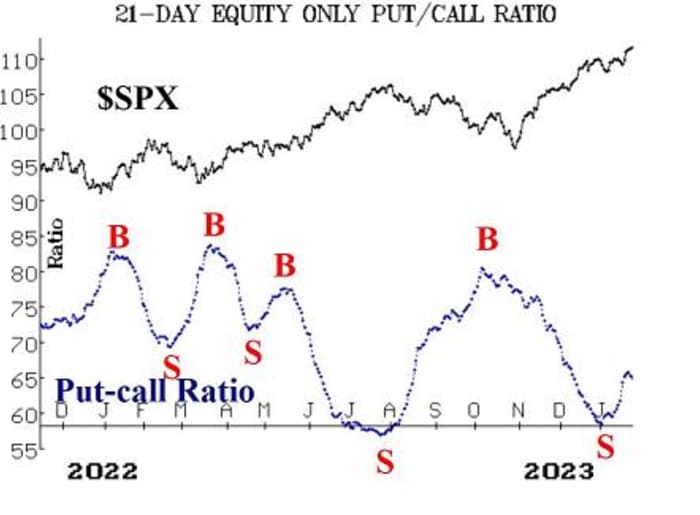
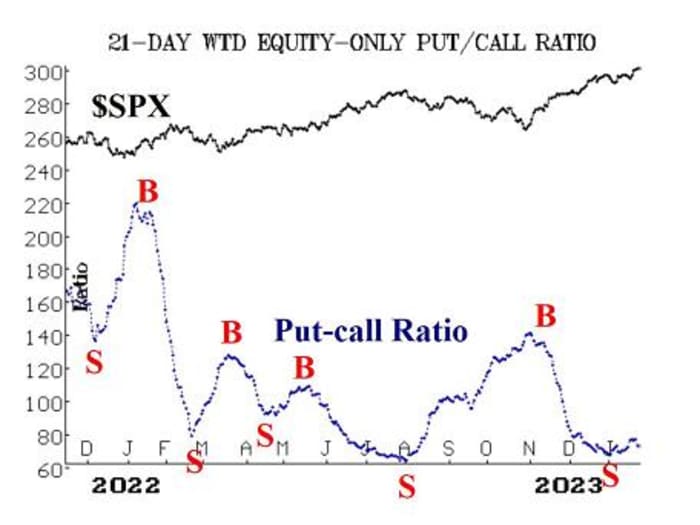
Both of the next two indicators — equity-only put-call ratios and breadth oscillators — are telling us that the average stock is not enjoying the bullishness of the S&P 500 and other major indices. So, once again, the rising market is a narrow one, but that has been the case for a couple of years, on and off, and hasn’t presented a large problem so far.
The equity-only put-call ratios have been some of the most negative indicators. Despite curling downward in the past couple of days, our computer-analysis programs still grade these charts as being on sell signals — i.e., sell signals for the stock market. As long as they are rising, that is bearish for stocks. If they should drop below their recent lows, they would return to a bullish state.


Breadth has also not been all that great, but both breadth oscillators are on buy signals at this time.
A week ago, we saw new lows on the New York Stock Exchange jump above new highs, but that situation has been completely reversed, as new highs have registered more than 100 on three of the last four trading days, and that has returned this indicator to a buy signal. This buy signal would only be stopped out if new lows on the NYSE exceed new highs for two consecutive days.
The CBOE Volatility Index
VX00,
VIX
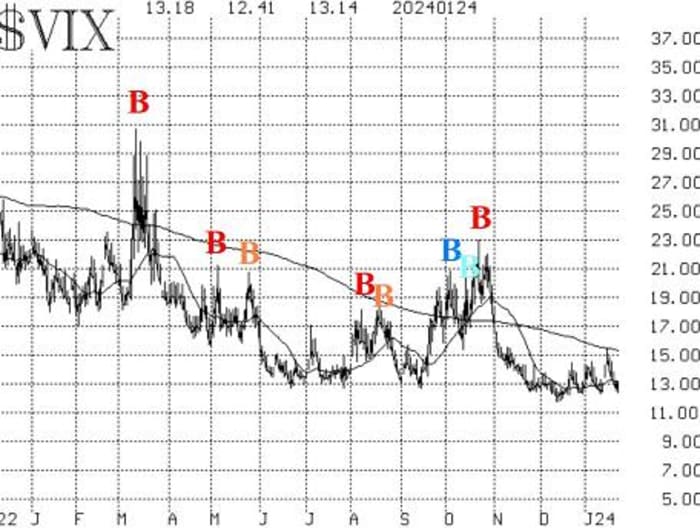
has remained in a subdued state and is trading near 13 again. That means that the trend of VIX buy signal is still in place. It will remain that way until VIX closes above its declining 200-day moving average, which is currently at 15.40. A low VIX is not a bearish sign; it only becomes worrisome for stocks when VIX begins to rise sharply. That hasn’t happened yet.

The construct of volatility derivatives remains in a bullish state for stocks, since the term structures slope upward, and the VIX futures are trading at large premiums over VIX. The first warning sign here would be if February VIX futures (the front month) were to close above March VIX futures. Again, that is not happening at this time.
A new bullish seasonality begins with this Friday’s close. It lasts for four days, and the system trade that we built around it has a good track record. See the “market insight” section for full details on this system’s history and the recommended trade.
Realized volatility has backed off, too. That means that the 20-day Historical Volatility of SPX, or HV20, has fallen back below 9%. That stops out the previous sell signal and returns this indicator to a neutral state. HV20 would now have to fall below 8% in order to possibly set up a new sell signal at a later date.
We continue to maintain a core bullish position, because of the positive nature of the S&P 500 chart. We are rolling calls up when they become deeply in the money. Furthermore, we will continue to trade new confirmed signals around that “core” position. One might have thought that new sell signals would be mostly bearish, but in fact the bearish ones are being stopped out, and new ones are mostly bullish.
New recommendation: New highs versus new lows buy signal
As noted above, new highs on the NYSE have numbered more than 100 for three of the last four trading days. In addition, they have outnumbered new lows by a large margin. That is a new buy signal for this indicator.
Buy 1 SPY Feb. (16) at-the-money call
The trade would be stopped out if new lows outnumber new highs on the NYSE for two consecutive days. Meanwhile, roll the SPDR S&P 500 ETF Trust
SPY
call up if it becomes 8 points in the money.
Market insight: January bullish seasonal trade
Mutual funds and other institutions often receive an inflow of cash just as a new year begins. They invest some of that cash immediately, which is why the market often rallies in the first few trading days of January. However, to some extent, they approach the end of the month with part of that cash still sitting on the books. They do not normally want to show an overly large cash balance at the end of the month, so they invest the rest of the available cash near the end of January.
Historically, prices tend to rally beginning at the close of the 18th trading day of January and continuing for four days. Originally, this seasonal trading system had a five-day holding period, but the fifth day has been too volatile, so we shortened our holding period several years ago to four days.
In the past 38 years, this system has produced 30 winners and eight losers, when measured in terms of S&P 500 prices. The average gain is 1.1% for the four days — certainly respectable. In some cases, it has been much more. The last two years have been very strong. In 2022, despite the beginning of a bear market, the January seasonal saw the S&P 500 rise by 6.1%, and last year it was up 2.7%.
We have looked for a correlation between what had previously happened in January, up to that 18th trading day, but there is not any strong evidence that the S&P 500 performance prior to the 18th trading day has much influence on what happens after it. The institutions are pretty much going to splurge no matter what.
At the close of trading on Friday, the 18th trading day of January, buy 2 SPY Feb. (9) at-the-money calls.
Roll the calls up if they become 6 points in the money. Sell all of the calls at the closing of trading four days later, on Thursday, Feb. 1.
Follow-up action
All stops are mental closing stops unless otherwise noted.
We are using a “standard” rolling procedure for our SPY spreads: In any vertical bull or bear spread, if the underlying hits the short strike, then roll the entire spread. That would be roll up in the case of a call bull spread or roll down in the case of a bear put spread. Stay in the same expiration and keep the distance between the strikes the same unless otherwise instructed.
Long 4 XLP
XLP
Feb. (16) 72 calls: The stop remains at 71.20.
Long 1 SPY Feb. (16) 485 call: This position was initially a long straddle. It was rolled up, and the puts were sold. The calls were rolled up several more times, including most recently on Jan. 22, when SPY traded at 485. This is, in essence, our “core” bullish position. Roll the calls up every time they become at least 8 points in the money.
Long 4 UNM March (15) 45 calls: We will hold this position as long as the weighted put-call ratio of Unum Group
UNM,
remains on a buy signal.
Long 1 SPY Feb. (16) 480 calls: This call was bought in line with the Cumulative Volume Breadth (CVB) buy signal. The CVB buy signal predicted that SPX would trade at a new all-time high, which it recently did. The calls were sold on Jan. 22 since new highs were attained.
Long 0 ESPR Feb. (16) 3 calls: These calls were stopped out on Jan. 18, when Esperion Therapeutics Inc.
ESPR,
closed below 2.25.
Long 2 DIS June (21) 90 puts: Sell these puts, since the weighted put-call ratio of DIS
DIS,
is no longer on a sell signal.
Long 1 SPY Feb. (16) 469 put and Short 1 SPY Feb. (16) 449 put: Was bought in line with the McMillan Volatility Band sell signal. It will reach its target if S&P 500 trades at the -4σ Band, and it will be stopped out if the S&P 500 closes above the +4σ Band. Today, that would be a close above 4,894. The Band moves daily, so it will not necessarily stay at 4,894 for tomorrow and succeeding days.
Long 1 SPY Feb. (16) 469 put and Short 1 SPY Feb. (16) 449 put: Was bought in line with the HV20 sell signal. This spread should be sold, since HV20 has fallen back to 9%, which stops out the trade.
Long 1 SPY Feb. (16) 469 put and Short 1 SPY Feb. (16) 449 put: Was bought because the so-called Santa Claus rally failed this year. The spread was stopped out when the S&P 500 closed above 4,800 for two consecutive days, ending on Jan. 22.
Long 1 QQQ Feb. (2) 409 put and Long 1 QQQ Feb. (2) 413 put: Sell the first Invesco QQQ Trust Series I
QQQ
put that becomes 20 points in the money, and roll the other down when and if it becomes 20 points in the money. Sell all the remaining puts at the close of trading on the 18th trading day of January — this Friday.
Long 1 SPY Feb. (16) 476 put and Long 1 SPY Feb. (16) 484 calls: In line with previous instructions, the call was rolled up when it became 8 points in the money. Sell the put now and continue to roll up every time the call is 8 points in the money.
Long 3 TLT
TLT
May (19) 95 put: We will hold as long as the put-call ratio sell signal is in place for Treasury bonds.
Send questions to lmcmillan@optionstrategist.com.
Lawrence G. McMillan is president of McMillan Analysis, a registered investment and commodity trading advisor. McMillan may hold positions in securities recommended in this report, both personally and in client accounts. He is an experienced trader and money manager and is the author of the best-selling book, Options as a Strategic Investment. www.optionstrategist.com
©McMillan Analysis Corporation is registered with the SEC as an investment advisor and with the CFTC as a commodity trading advisor. The information in this newsletter has been carefully compiled from sources believed to be reliable, but accuracy and completeness are not guaranteed. The officers or directors of McMillan Analysis Corporation, or accounts managed by such persons may have positions in the securities recommended in the advisory.
This story originally appeared on Marketwatch

