
Image source: Getty Images
The S&P 500’s recent volatility reflects several things, many of them connected. The index has shed 10% since mid-February 2025, driven primarily by President Donald Trump’s aggressive tariff policies. His March 2025 decision to impose 20% tariffs on Chinese imports and levies on Canadian goods triggered a $4trn market value wipeout. More tariffs will be announced next week.
These protectionist measures have heightened fears of a global trade war, and the S&P 500 briefly erased all post-November 2024 gains. At the time of writing (26 March), we’ve seen a small rally. However, the stocks are still cheaper than when they were when Trump took office.
Mixed signals
Volatility has become endemic as investors grapple with conflicting signals. Trump’s admission of a potential “period of transition” post-tariffs contrasts with the Federal Reserve’s stabilising commentary.
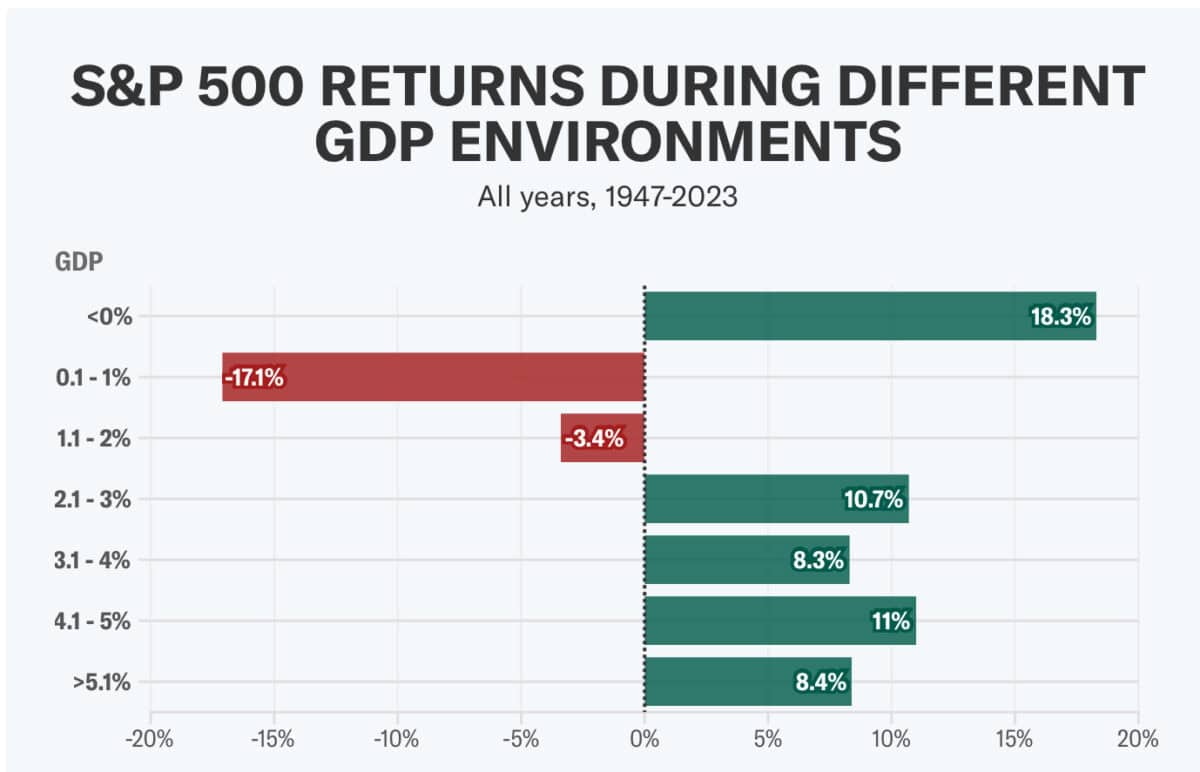
This policy whipsaw has compressed valuations, with the S&P 500’s forward price-to-earnings (P/E) ratio retreating from 21.5 times to 20.6 times. Goldman Sachs consequently revised its 2025 year-end target to 6,200 (from 6,500). The bank cited reduced GDP growth forecasts (1.7% vs 2.4%) and weaker earnings expectations.
And it’s these earnings forecasts that are actually the important bit. Earnings projections have deteriorated sharply. S&P 500 profit growth estimates for the first quarter of 2025 have nearly halved from 12.2% to 7.7% since January. Full-year earnings growth forecasts now stand at 10.5%, down from 14%, as tariff impacts ripple through supply chains.
And this is very important for our investment theses. Because if a stock was trading at 14 times forward earnings with a 14% forward growth rate, it may look like fair value. But if that earnings expectation falls to 10.5% for the current year and medium term, investors will start to think it’s overvalued. That’s what the P/E-to-growth (PEG) ratio tells us.
Technical signals — mathematical calculations based on historical price and volume — suggest Oversold conditions. However, technical signals aren’t forecasts and can’t account for things like a bad earnings report. Personally, I’m tempted to hold off until the next earnings season. This typically starts a few weeks after the end of March. It could be a bad earnings season, much worse than the market is pricing in. The index could tank.
This one is bucking the trend
Berkshire Hathaway‘s (NYSE:BRK.B) stock has surged while the S&P 500 has faltered. Shares of Warren Buffett’s conglomerate reached new all-time highs, outpacing the broader market by a significant margin. This outperformance can be partially attributed to Berkshire’s strong performance, but also it’s substantial cash position, which stands at an impressive $334bn.
Despite holding major stakes in S&P 500 companies like Apple and Bank of America, Berkshire’s cash reserves provide a buffer against market volatility and potential opportunities for acquisitions during market downturns. This strategy could prove even more advantageous if the stock market experiences a further pullback.
However, investors should be aware of the risk associated with Berkshire’s heavy US focus. This US focus has been a strength in recent decades but some may argue it’s over concentrated geographically.
Nevertheless, the company’s track record and Warren Buffett‘s investment acumen make it an attractive long-term holding. I’ve added the stock to both my daughter’s portfolio and mine.
This story originally appeared on Motley Fool