Early Friday futures trading shows stock indices on the front foot. Whether they hold that optimism into Wall Street’s opening bell may depend on labor market data.
A U.S. nonfarm payrolls report that shows steady jobs growth and tepid wage inflation will be the preferred outcome for equity bulls because it shouldn’t discourage the Federal Reserve from starting to cut borrowing costs in the spring.
Until then investors can welcome the propulsion provided by well-received earnings reports from Meta Platforms
META
and Amazon.com
AMZN
— though a less favorable response to Apple’s
AAPL
numbers may contain the ebullience.
Yes, yet again, big tech is lifting the market. A danger for investors is thinking this will always be so; that U.S. tech’s dominance means Wall Street will continually benefit from what’s been termed ‘American exceptionalism’.
But nothing lasts for ever notes Dan Suzuki, deputy chief investment officer at Richard Bernstein Advisors: “Positioning and valuation suggest that investors expect the U.S. equity dominance of the past 15 years will last indefinitely, but history seems to suggest otherwise.”
He explains that eventually, high valuations and unattainable growth expectations lead to disappointments and significant devaluations. “The subsequent period of deteriorating fundamentals and weak returns causes the pendulum to swing to opposite extremes,” Suzuki says.
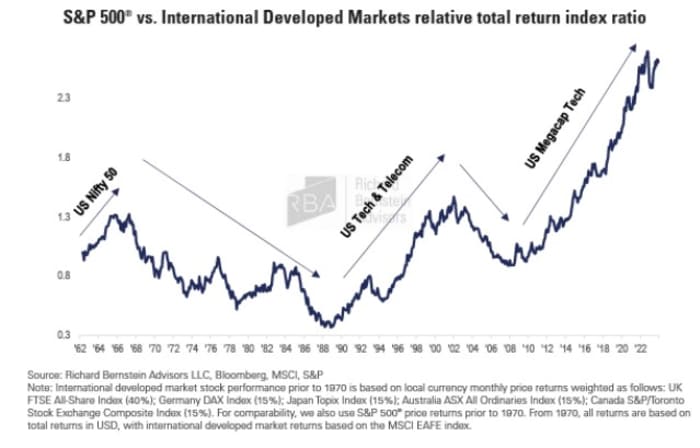
Consequently, those periods of significant outperformance are often to be followed by periods of notable underperformance, As the chart below shows, this can result in sectors enjoying even the most formidable of secular themes reversing much of their previously earned extraordinary gains.
Source: Richard Bernstein Advisors
To illustrate how big themes can rise and fall, Suzuki has identified what he considers the best trades of the last 50 years. Each would have generated excess returns averaging 7-19% per year spanning periods of 8-22 years, he notes.
First: International stocks over U.S. stocks (1967 – 1988) — the dark blue line in the chart above. The dominant U.S. Nifty 50 large caps eventually failed to live up to lofty investor expectations, giving way to international stock leadership, especially driven by the ascent of efficient Japanese manufacturers.
Second: US stocks over cash (1987 – 2000) — the green line. After the 1987 stock market crash, U.S. stocks “climbed a wall of worry until telecommunication and technology stocks took the reins beginning in the mid-1990s, while interest rates on cash continued to fall,” says Suzuki.
Next: Energy stocks over the broad market (2000 – 2008) — lighter blue line. The bursting technology bubble and the great financial crisis weighed on broad index returns, while strong emerging market growth caused energy demand to outstrip supply.
Finally: US stocks over cash (2009 – 2023). After the 2008 financial crisis, Wall Street climbed another wall of worry. A prolonged period of low interest rates not only minimized cash returns but also boosted liquidity and investment demand for high growth technologies.
Suzuki observes that each time these trends became the pervasive sentiment, it generally signaled that the next big investment opportunities lay elsewhere.

Source: Richard Bernstein Advisors
Crucially, Suzuki thinks there is danger now in investors’ view that the U.S. is back to being ‘the only investment worth owning’.
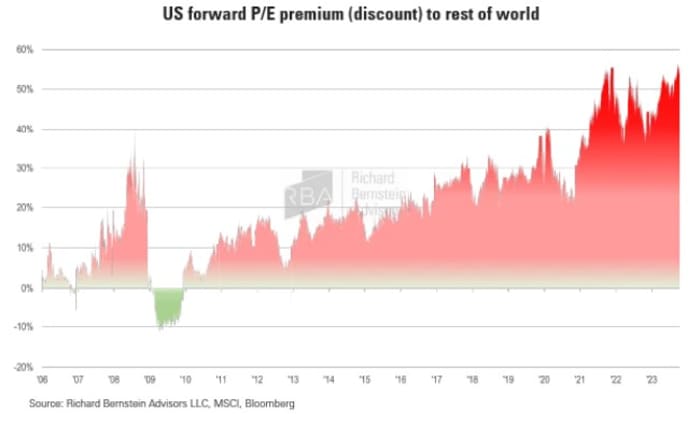
Here’s some figures that seems to underpin that viewpoint. The U.S. share of the global stock market has surged from 40% to 64%, while market concentration has hit unprecedented levels, with the largest 10 stocks worth more than 30% of the S&P 500 index.
Furthermore, the U.S, is the most expensive it has ever been compared to the rest of the world, with the premium having gone from -11% (a discount) in 2009 to +60% today. “But rather than take steps to mitigate this extreme portfolio concentration, it appears that investors are doubling down,” Suzuki notes, with the average retail investor’s stock portfolio having 40% tied up in just three tech stocks.

Source: Richard Bernstein Advisors
The current dominant trade is set to end, says Suzuki. “Market leadership tends to change in response to structural shifts in the macroeconomic fundamentals. The global economy is currently undergoing major inflections across inflation, interest rates, globalization, corporate profitability, demographics and government balance sheets,” he says.
Add those shifts to the prevailing tech omnipotence noted above and investors are facing “a once-in-a-generation opportunity to rebalance portfolios.”
“With all eyes on U.S. large cap growth stocks and disinflation beneficiaries, we see bigger opportunities in international, small caps, value stocks and inflation beneficiaries, Suzuki concludes.
Markets

U.S. stock-index futures
ES00
NQ00
are higher early Friday as benchmark Treasury yields
nudge up. The dollar
is a bit softer, while oil prices
CL
gain and gold
GC00
trades around $2,050 an ounce.
| Key asset performance | Last | 5d | 1m | YTD | 1y |
| S&P 500 | 4,906.19 | 0.31% | 4.45% | 2.86% | 18.61% |
| Nasdaq Composite | 15,361.64 | -0.61% | 5.77% | 2.33% | 27.94% |
| 10 year Treasury | 3.885 | -25.86 | -16.12 | 0.36 | 36.08 |
| Gold | 2,071.80 | 2.66% | 0.94% | 0.00% | 10.34% |
| Oil | 74.44 | -4.84% | 0.66% | 4.36% | 1.65% |
| Data: MarketWatch. Treasury yields change expressed in basis points | |||||
For more market updates plus actionable trade ideas for stocks, options and crypto, subscribe to MarketDiem by Investor’s Business Daily.
The buzz
The January nonfarm payrolls report will be published at 8:30 a.m. Eastern. Economists forecast that a net 185,000 jobs were added, down from 216,000 in December. The unemployment rate is expected to move up from 3.7% to 3.8%, while month-on-month hourly wages will grow 0.3% against 0.4% in December.
Other U.S. economic data due on Friday, includes December factory orders alongside January consumer sentiment at 10 a.m.
Shares of Meta Platforms
META
and Amzon.com
AMZN
are higher in premarket action after well-received results late Thursday, including in Meta’s case a $50 billion buyback and maiden dividend.
Apple stock
AAPL
is down, though, after it revealed weak sales in China.
U.S. companies reporting before the opening bell on Friday, include Chevron
CVX,
Exxon Mobil
XOM,
Bristol Myers Squibb
BMY,
CBOE Global Markets
CBOE
and Aon
AON.
Panicky selling pushed the Shanghai Composite index
in China down 4% at one point on Friday. It pared the decline to 1.5%, but that was still its lowest close in nearly four years.
Best of the web
India is winning over investors as Chinese stocks struggle.
Bao Fan: missing China billionaire banker returns to resign.
Stocks for the looong run: could Japan’s lost decades happen in America?
The chart
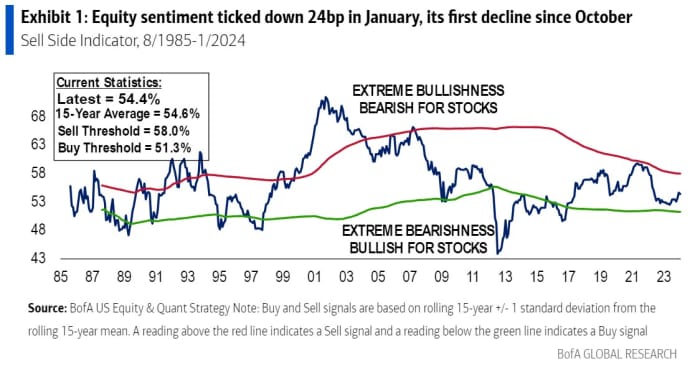
Good news for equity bulls: investors aren’t particularly bullish! Bank of America’s Sell Side Indicator — which tracks strategists’ average recommended allocation to equities in a balanced fund — nudged down in January, and at 54.4 is decidedly neutral. It’s a contrarian indicator, so those long stocks would rather it did not show analysts are gung-ho.

Top tickers
Here were the most active stock-market tickers on MarketWatch as of 6 a.m. Eastern.
Random reads
Where there’s muck there’s brass: Baltimore edition.
And if you can’t sell your rubbish: House made of bottles.
Tesla crashes into fjord. Cue the most Scandinavian rescue imaginable.
Need to Know starts early and is updated until the opening bell, but sign up here to get it delivered once to your email box. The emailed version will be sent out at about 7:30 a.m. Eastern.
Check out On Watch by MarketWatch, a weekly podcast about the financial news we’re all watching – and how that’s affecting the economy and your wallet. MarketWatch’s Jeremy Owens trains his eye on what’s driving markets and offers insights that will help you make more informed money decisions. Subscribe on Spotify and Apple.
This story originally appeared on Marketwatch

